Safety answers buried in rows of numbers
EBE helps enterprise carriers across the US keep their fleets safe and compliant. Every violation caught early and every certification renewed on time means safer roads and lower costs. The data was there, but fleet managers had to dig through dense tables to act on it. EBE wanted a dashboard that shows this value in seconds and gives its customers every reason to stay with the platform.
- Safety performance lived in dense data tables
- Managers pieced trends together by hand
- Spotting high-risk drivers meant manual digging
- The platform's value was hard to see in seconds
Built around the questions fleet managers ask every day
Symmetria partnered with EBE and led the UX/UI design. Each screen starts from a question a fleet manager needs answered, such as which drivers are high risk or which certifications are due, and answers it visually instead of in a table.
Visuals that do the reading
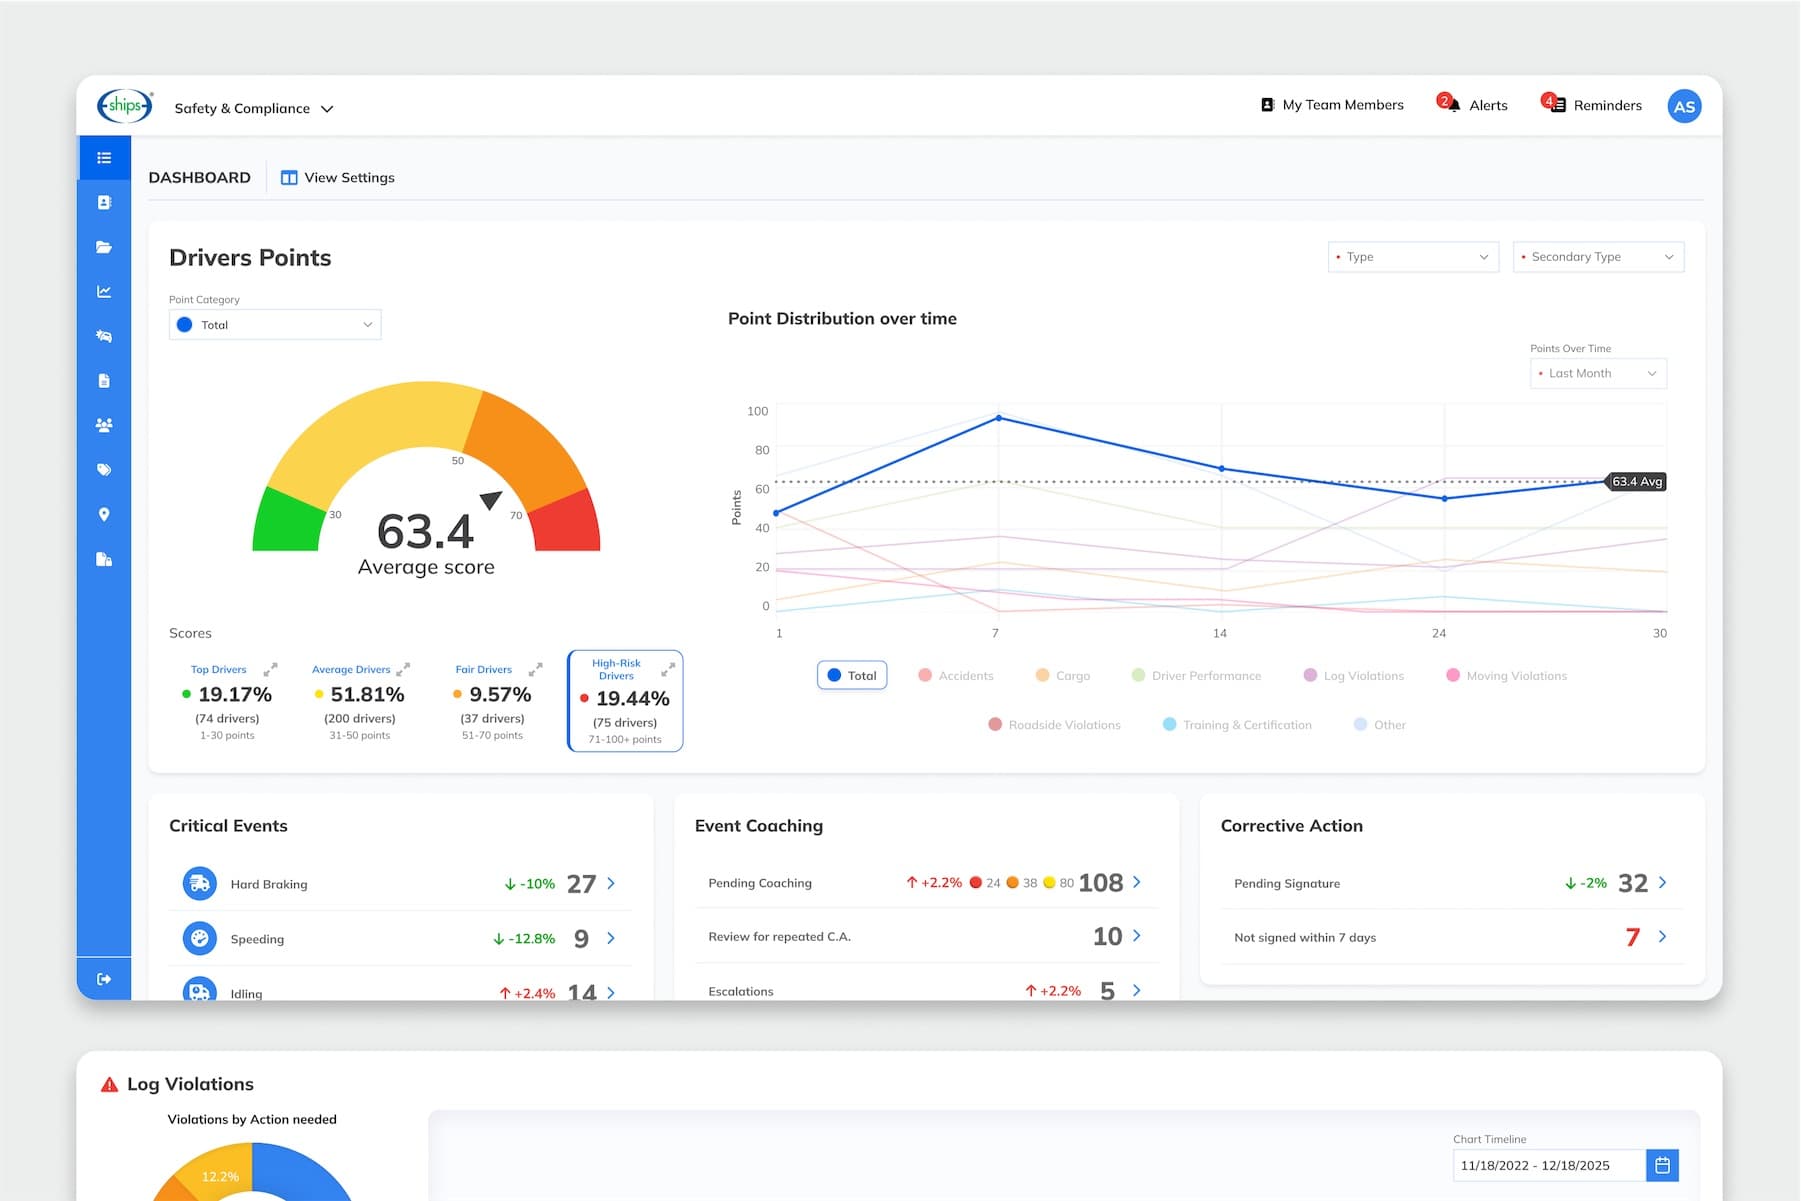
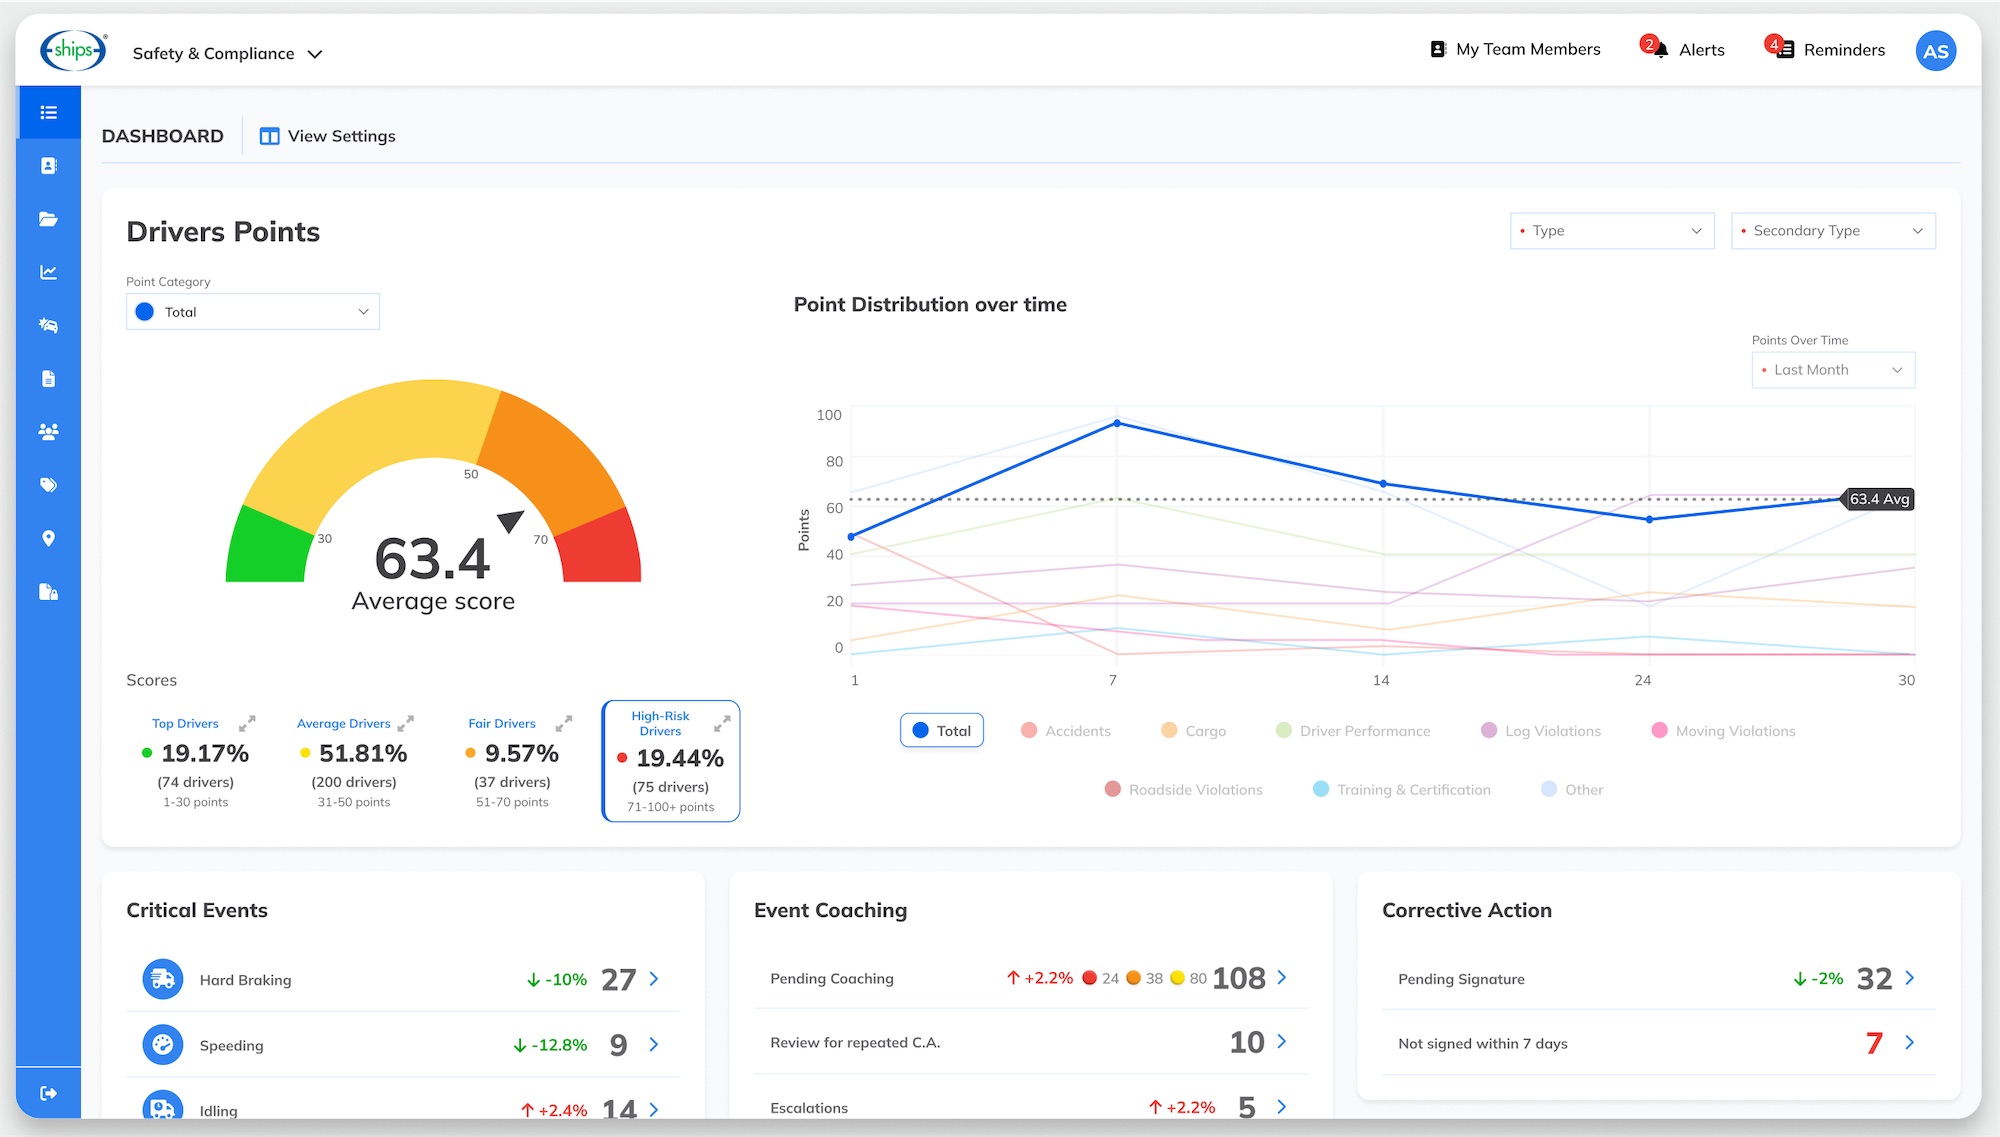
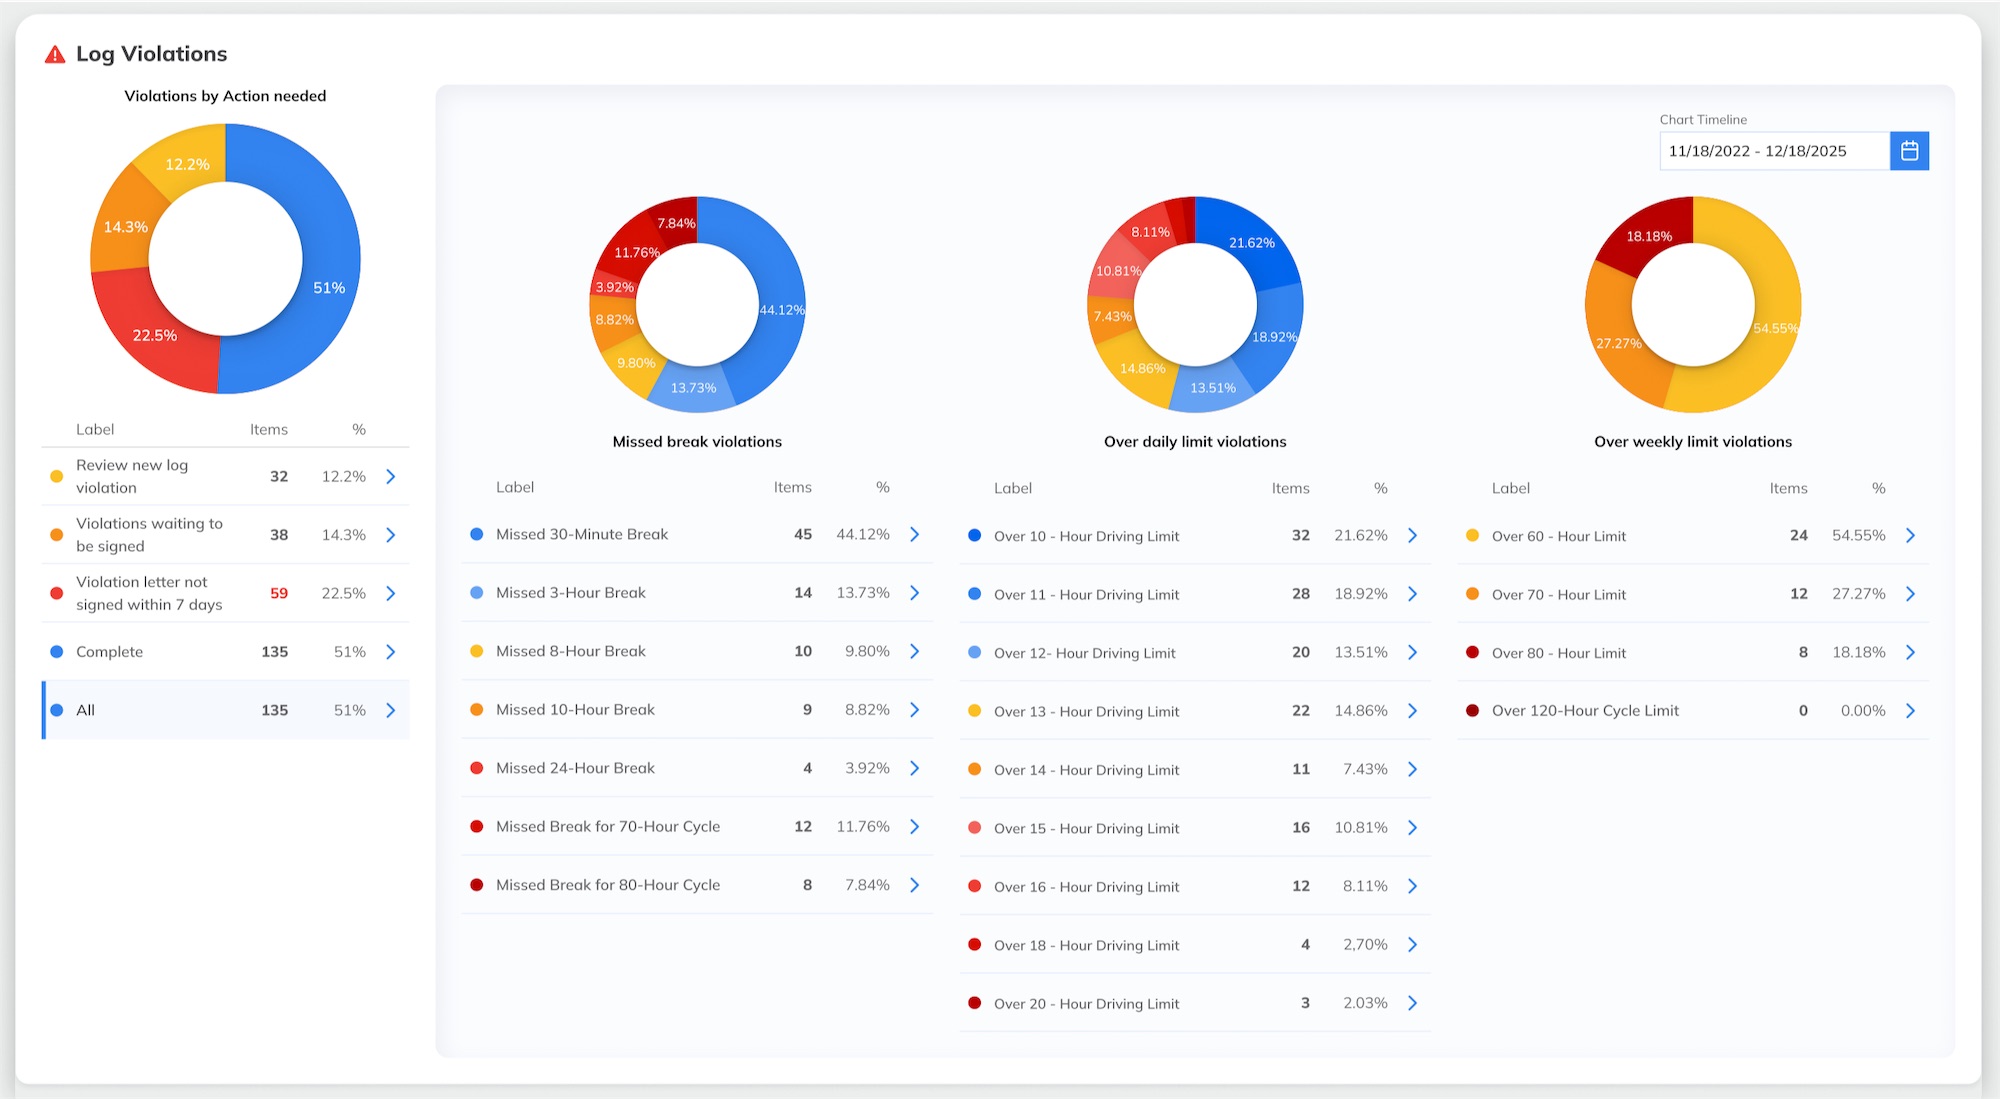
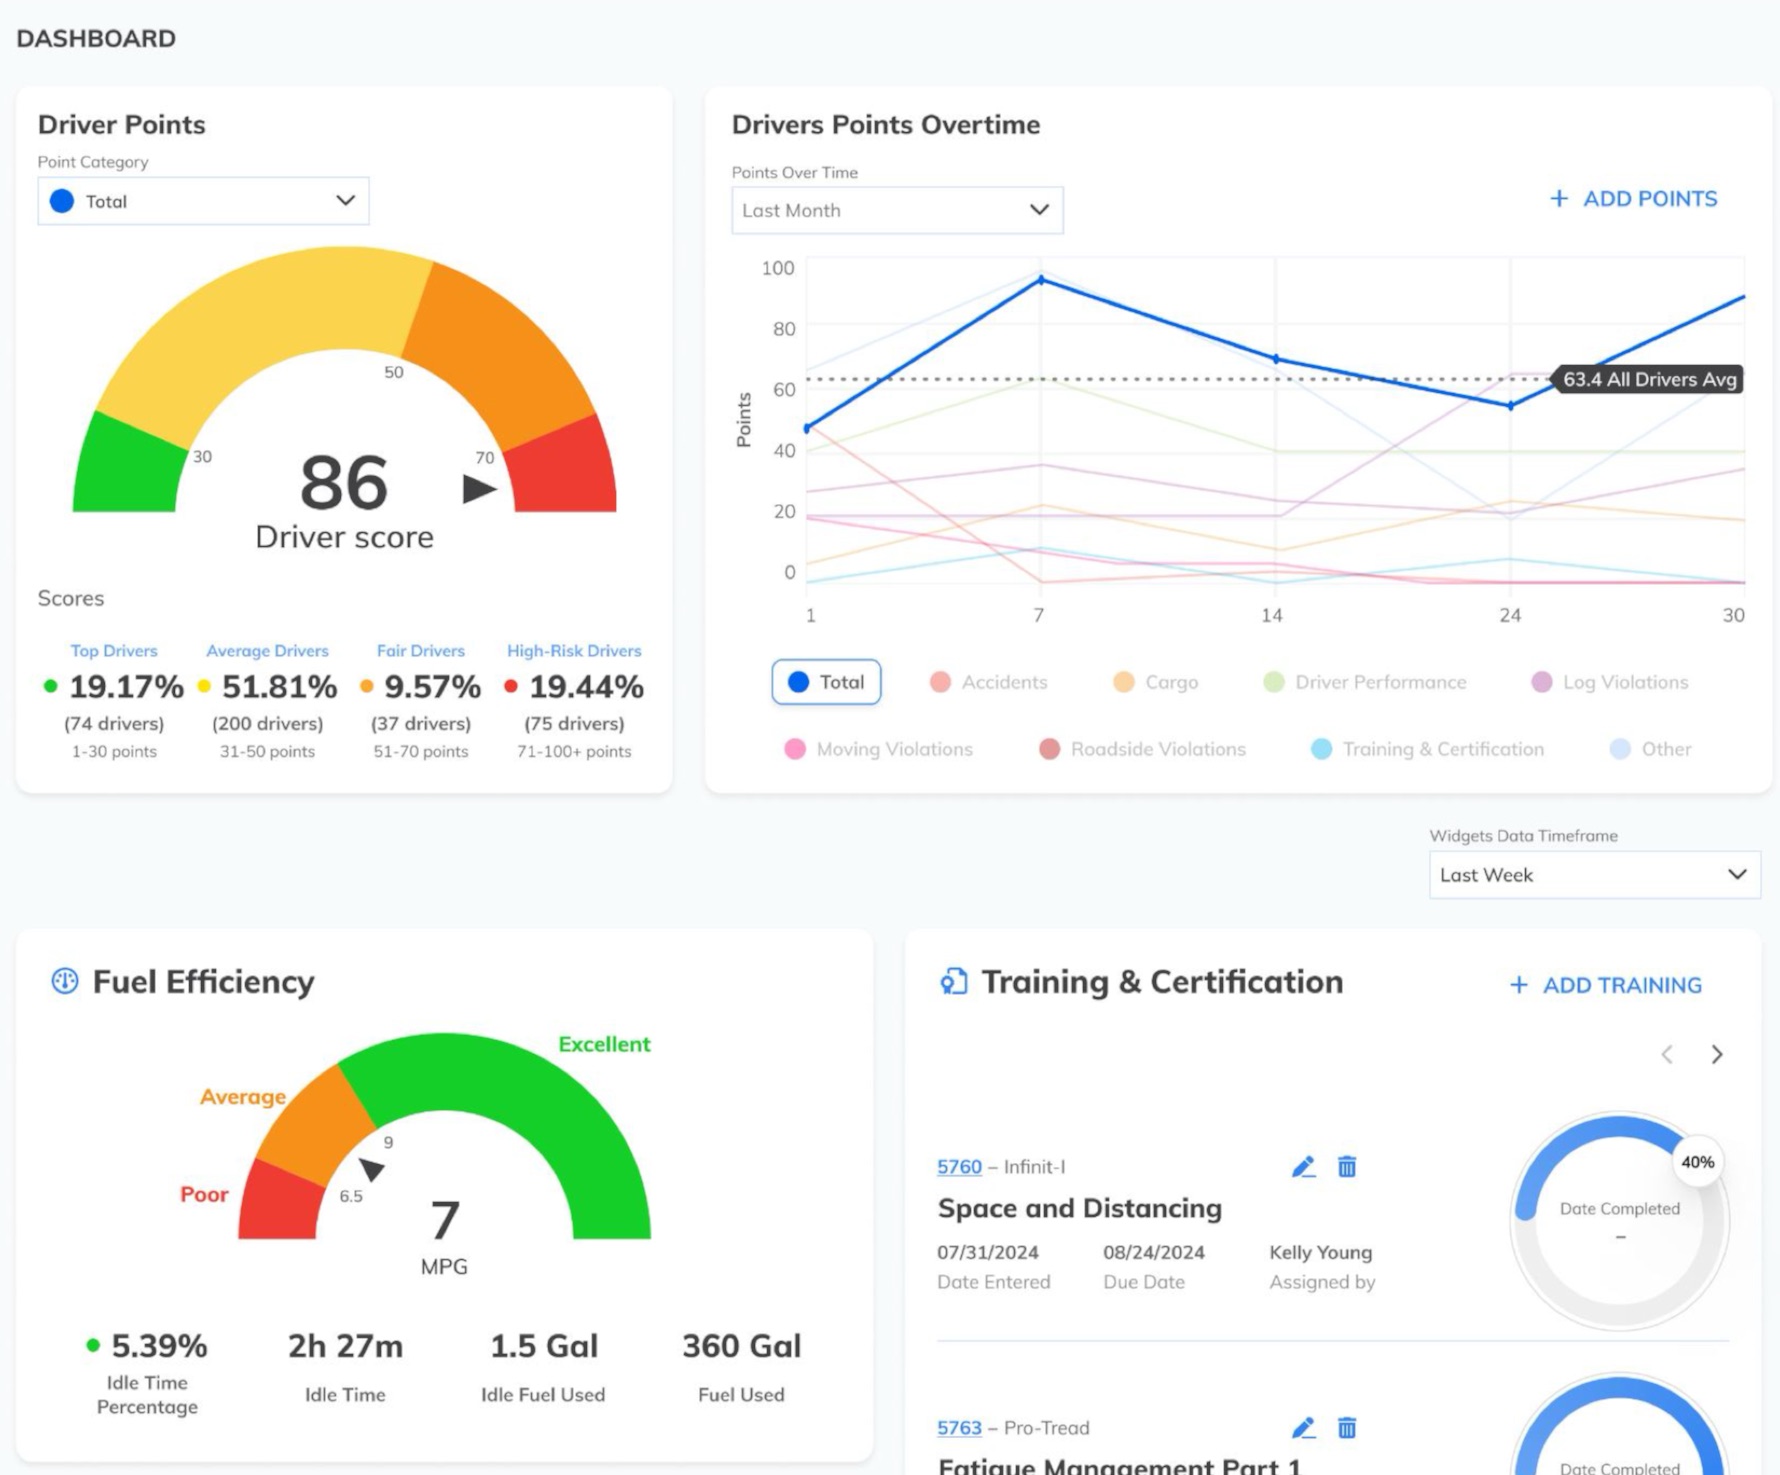
Charts, gauges and color-coded indicators replaced rows of numbers. High-risk situations stand out right away, so managers can act on what matters most, first.
The summary and the detail behind it
A KPI overview gives the fleet's safety picture in one read. Violation logs hold the detail behind each number for when a manager needs to dig in.
A full profile for every driver
Each driver profile gathers performance score, points trend, fuel efficiency, training status and inspection insights, down to violation categories and out-of-service status.
Calm screens, consistent modules
Clear visual hierarchy and careful grouping keep data-heavy screens calm and easy to read. Interaction and visual design guidelines make every module look and behave the same.
What We Delivered
- Fleet safety dashboard with KPI overview and violation logs
- Driver profile with performance score and points trend
- Fuel-efficiency gauges
- Training and certification tracker
- Inspection insights: violations, categories and out-of-service status
- Interaction and visual design guidelines
A Closer Look
 (opens full size in a new tab)
 (opens full size in a new tab)
 (opens full size in a new tab)
- Daily
- Part of fleet managers' routine at EBE's enterprise customers since the 2025 launch
- Instant
- Answers that used to take manual digging
- At a Glance
- High-risk situations stand out right away